Question: How does SceneRig compare with TabletopGen and PAT3D?
Each row is a method; each column is one of five samples. Switch all 15 reconstructions between the source view and a nearby view at +30° azimuth. Input images are linked below the column headings; select any reconstruction for a larger version.
Scroll horizontally to compare all five samples. Method labels stay visible.
| Method | Breakfast tableInput image ↗ | Clutter fruitInput image ↗ | IMG_8334Input image ↗ | bridge_7Input image ↗ | bridge_2Input image ↗ |
|---|---|---|---|---|---|
| TabletopGen | 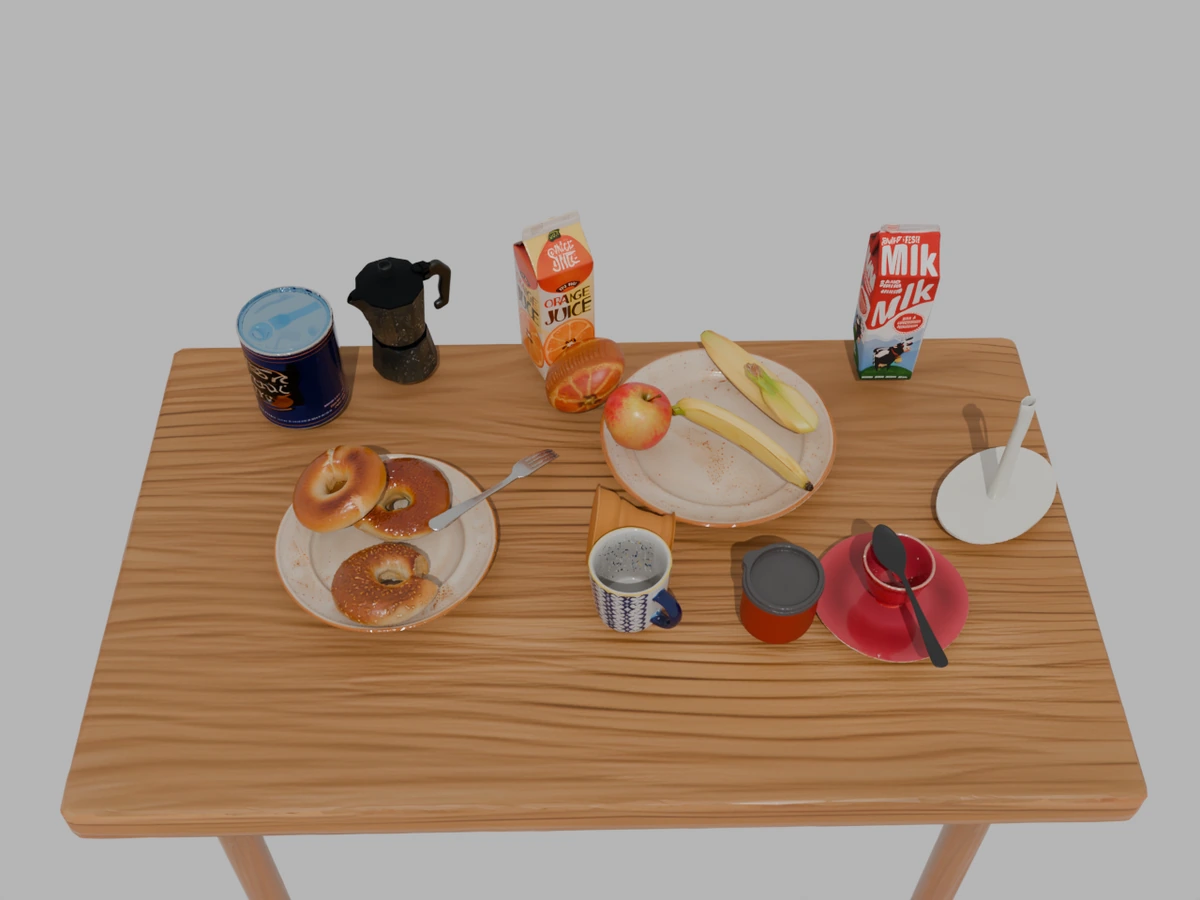 | 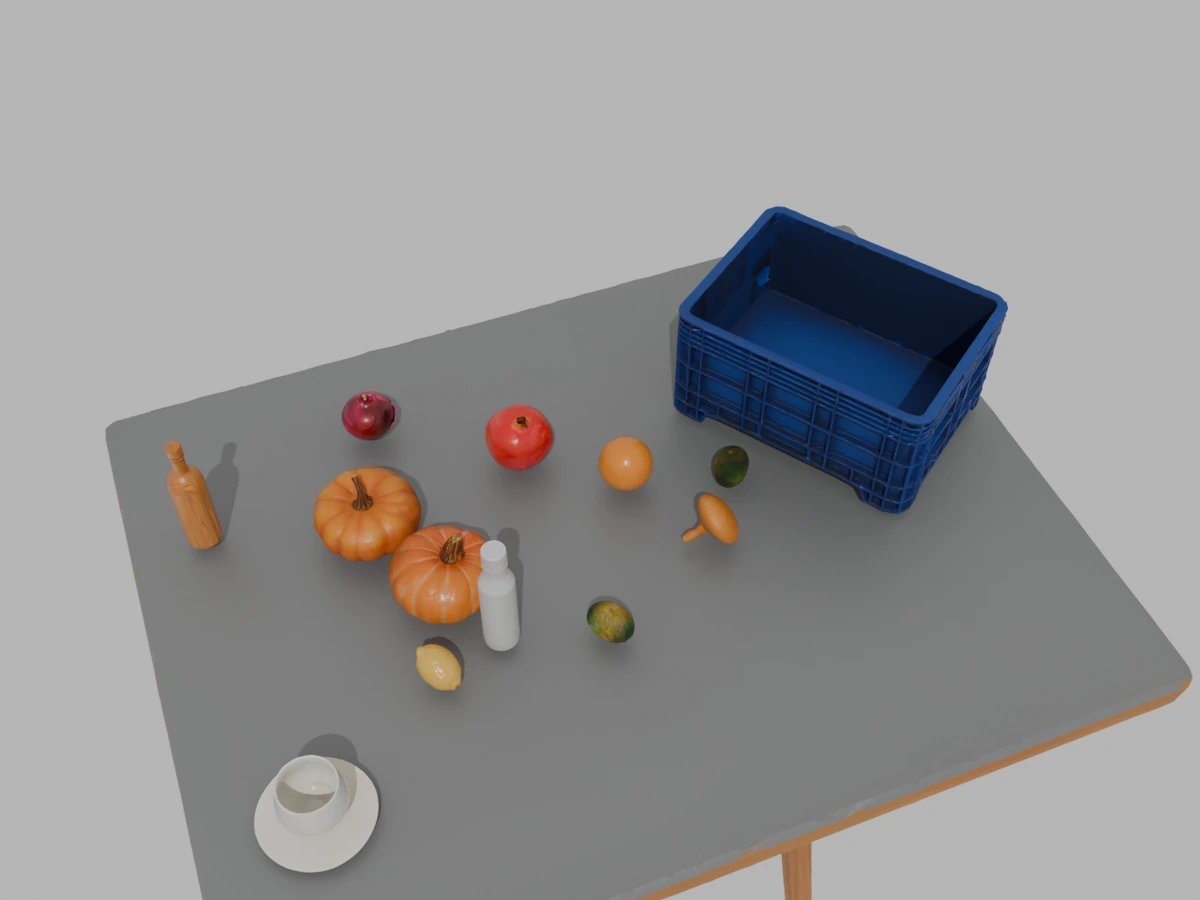 | 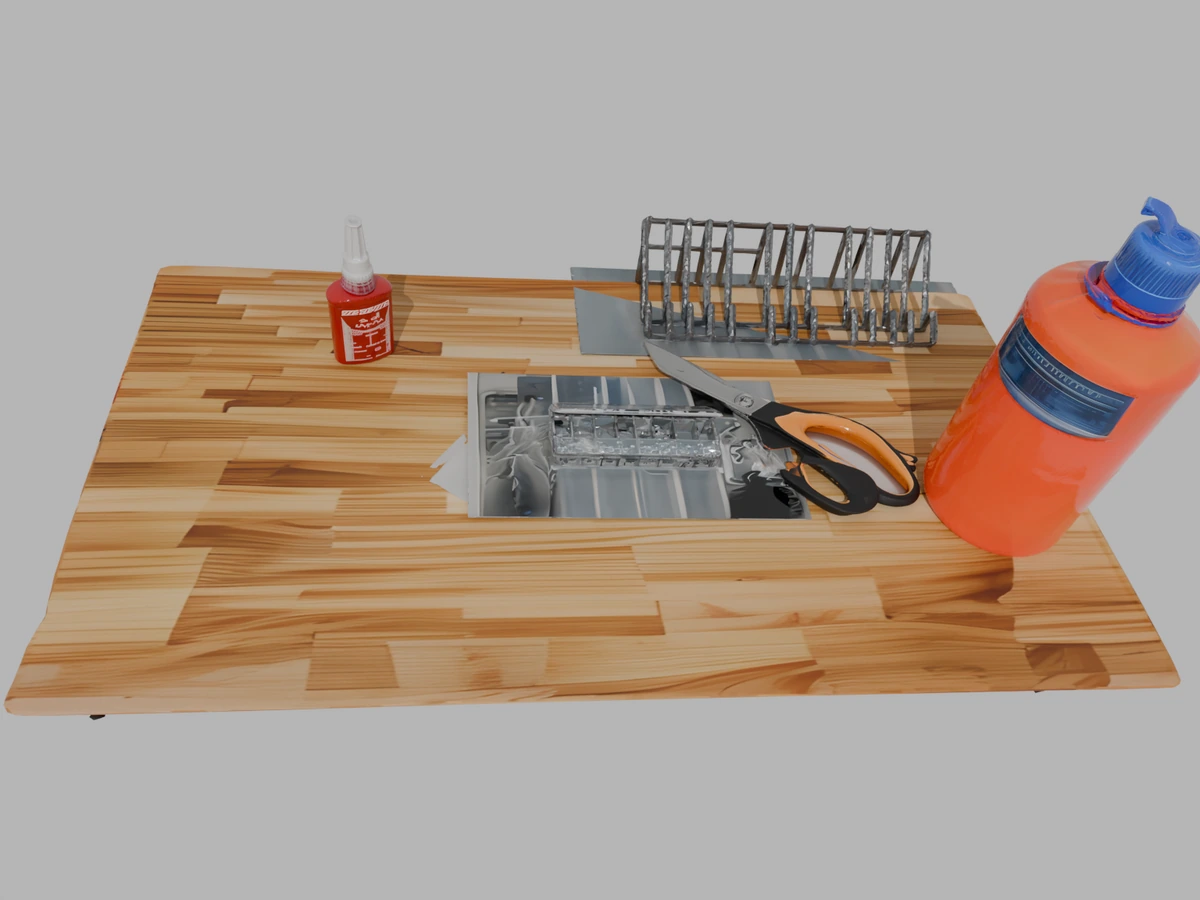 | 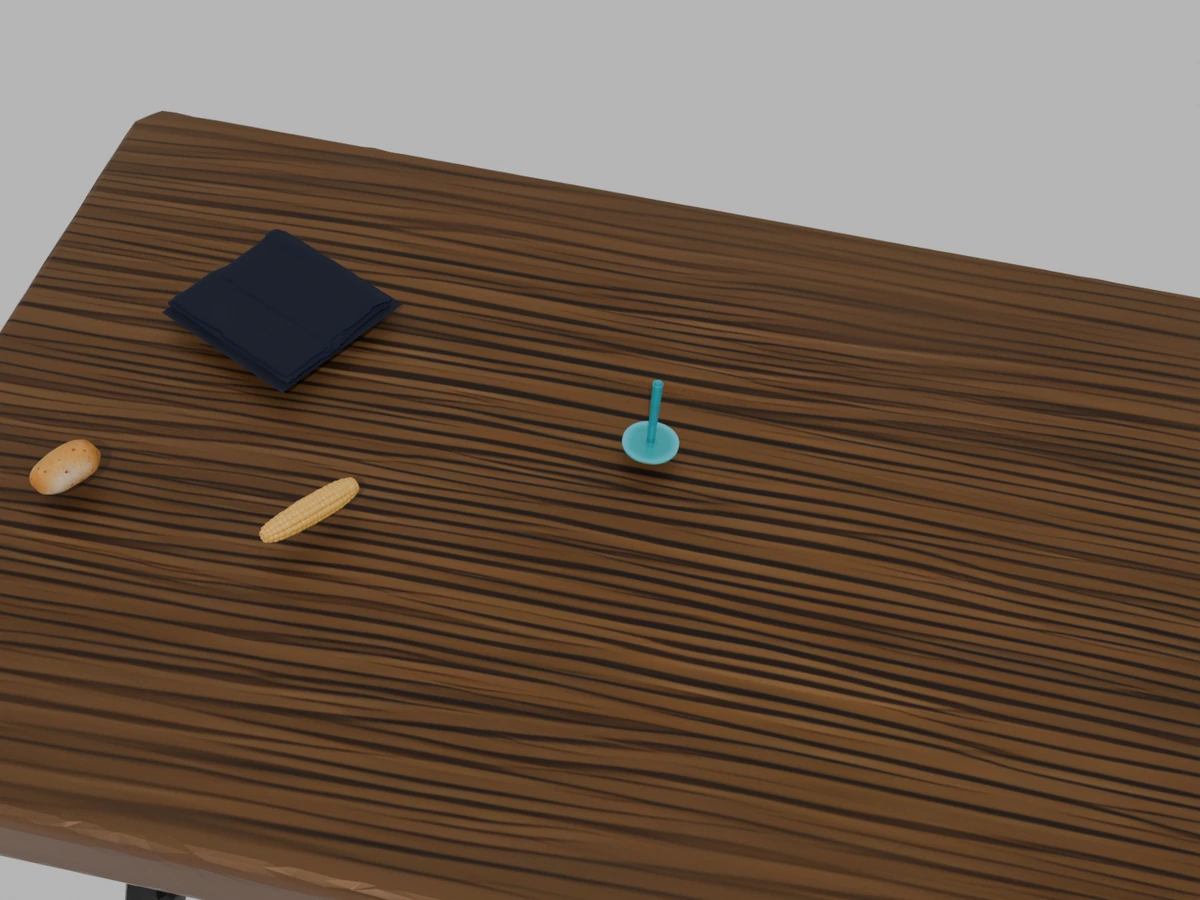 | 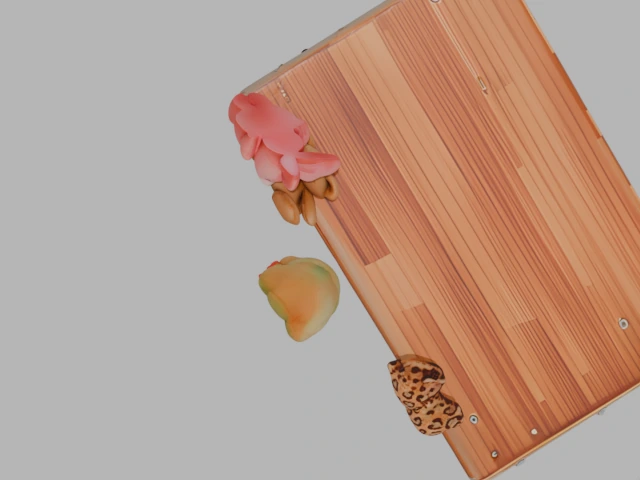 |
| PAT3D | 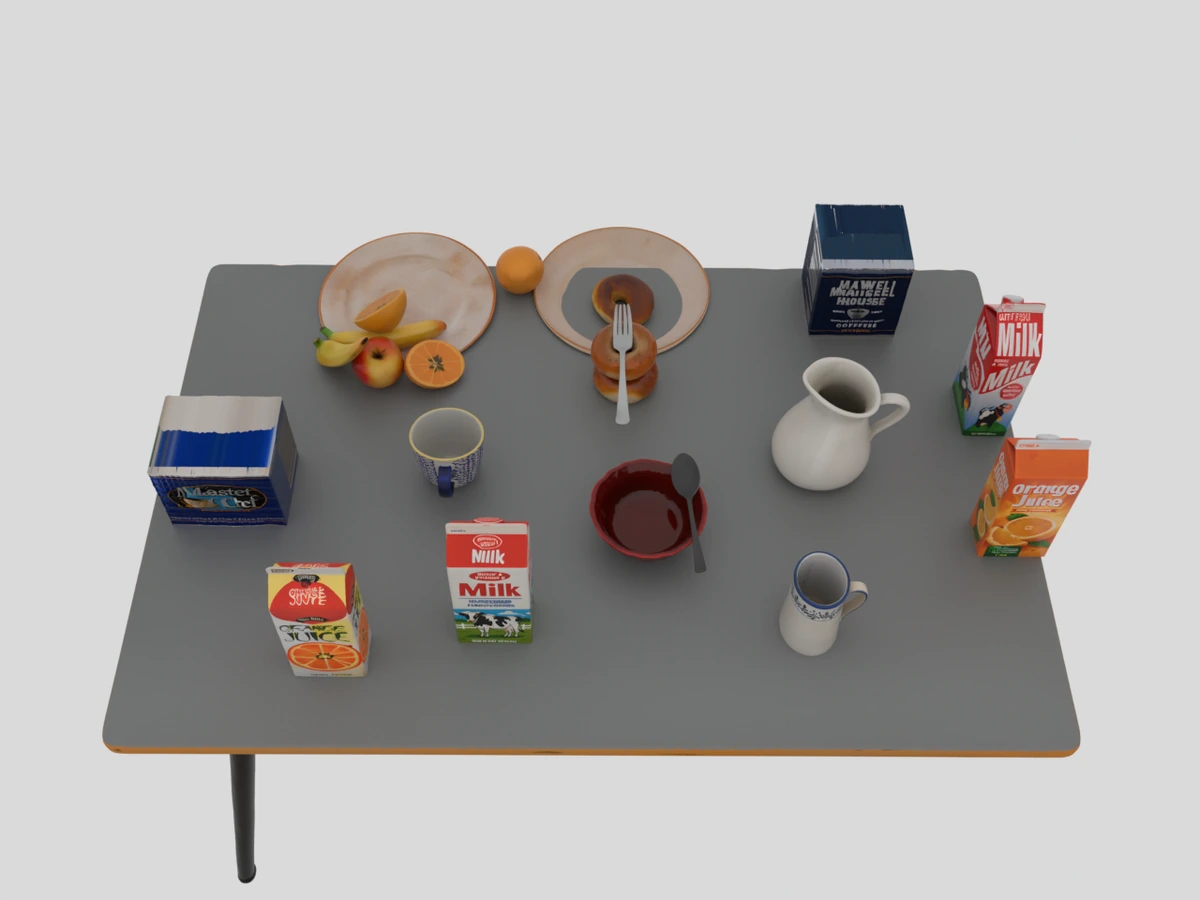 | 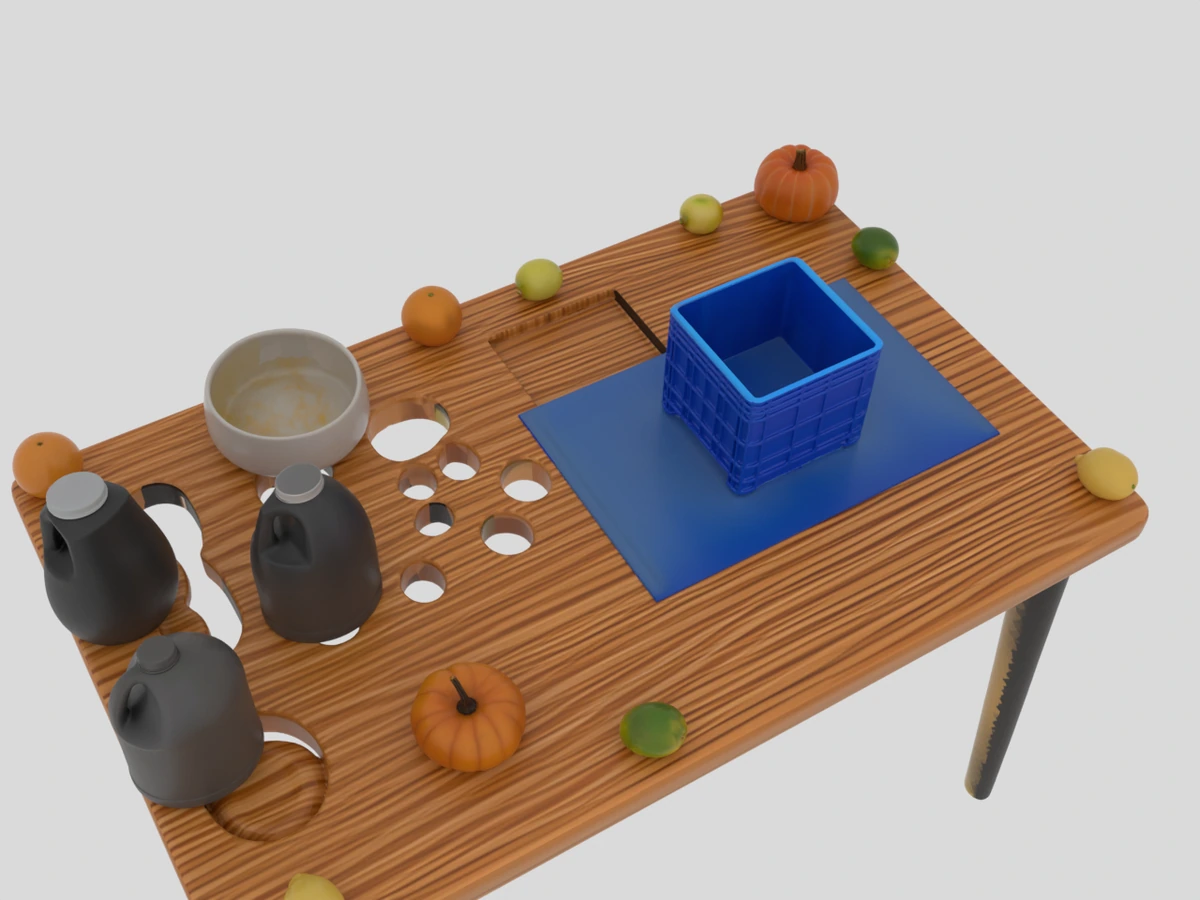 | 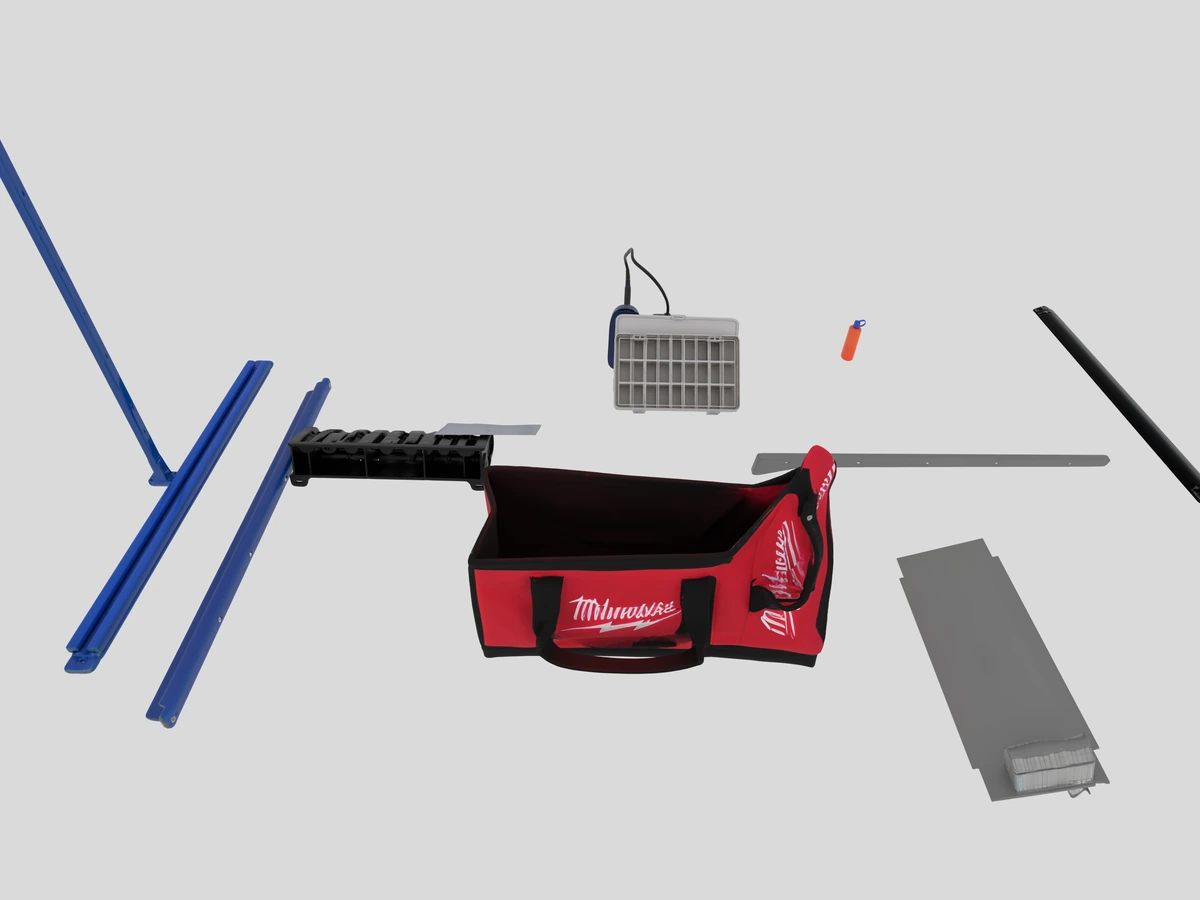 | 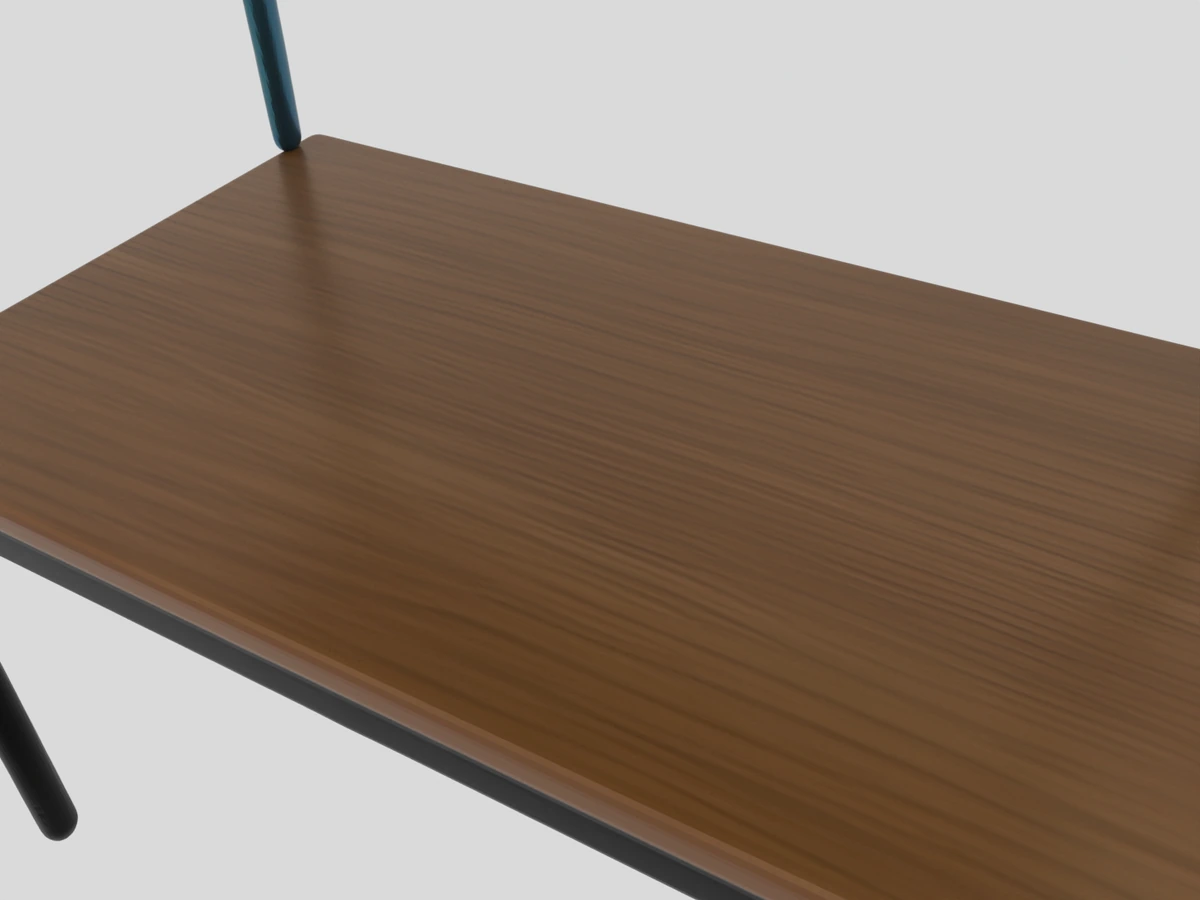 | 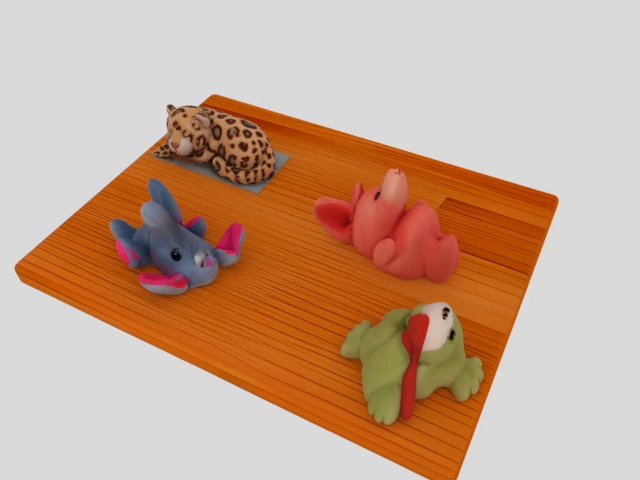 |
| SceneRig (ours) | 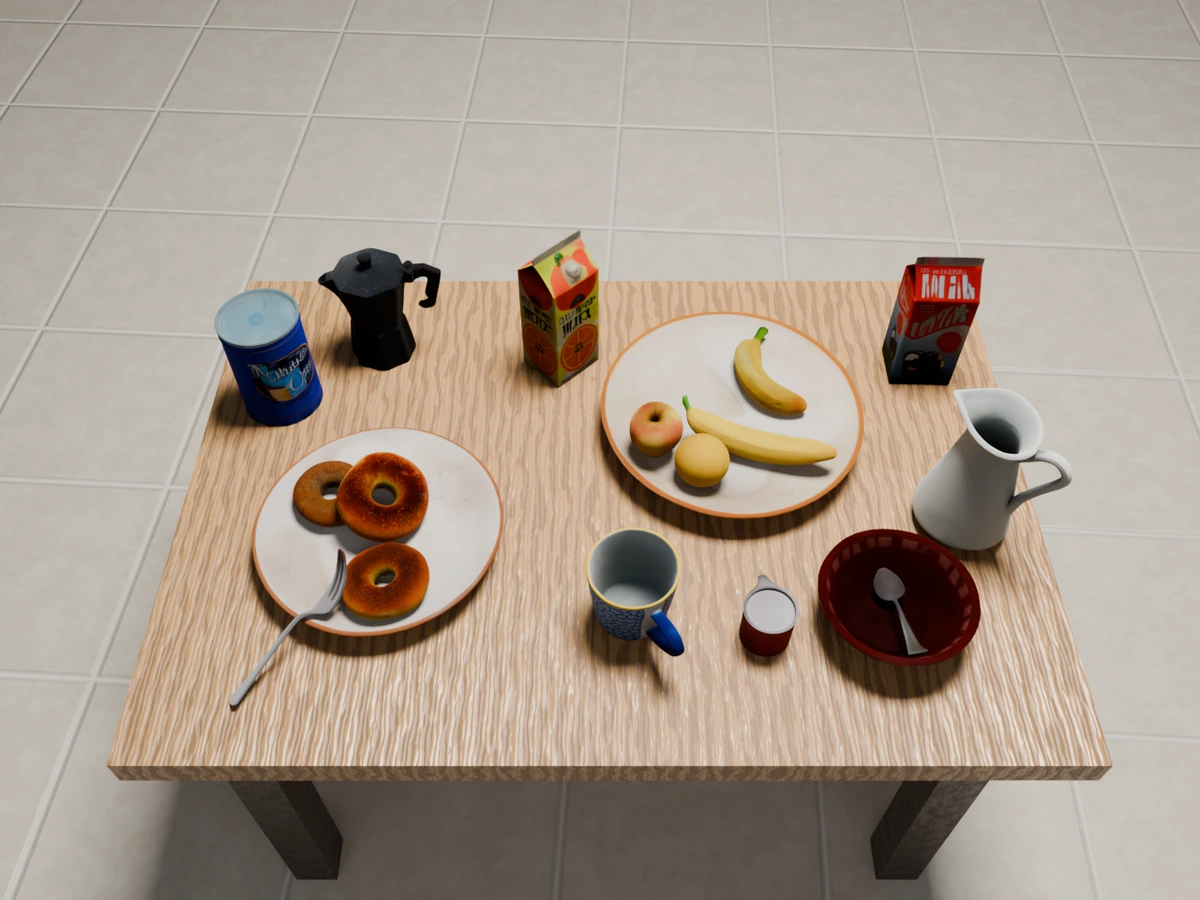 | 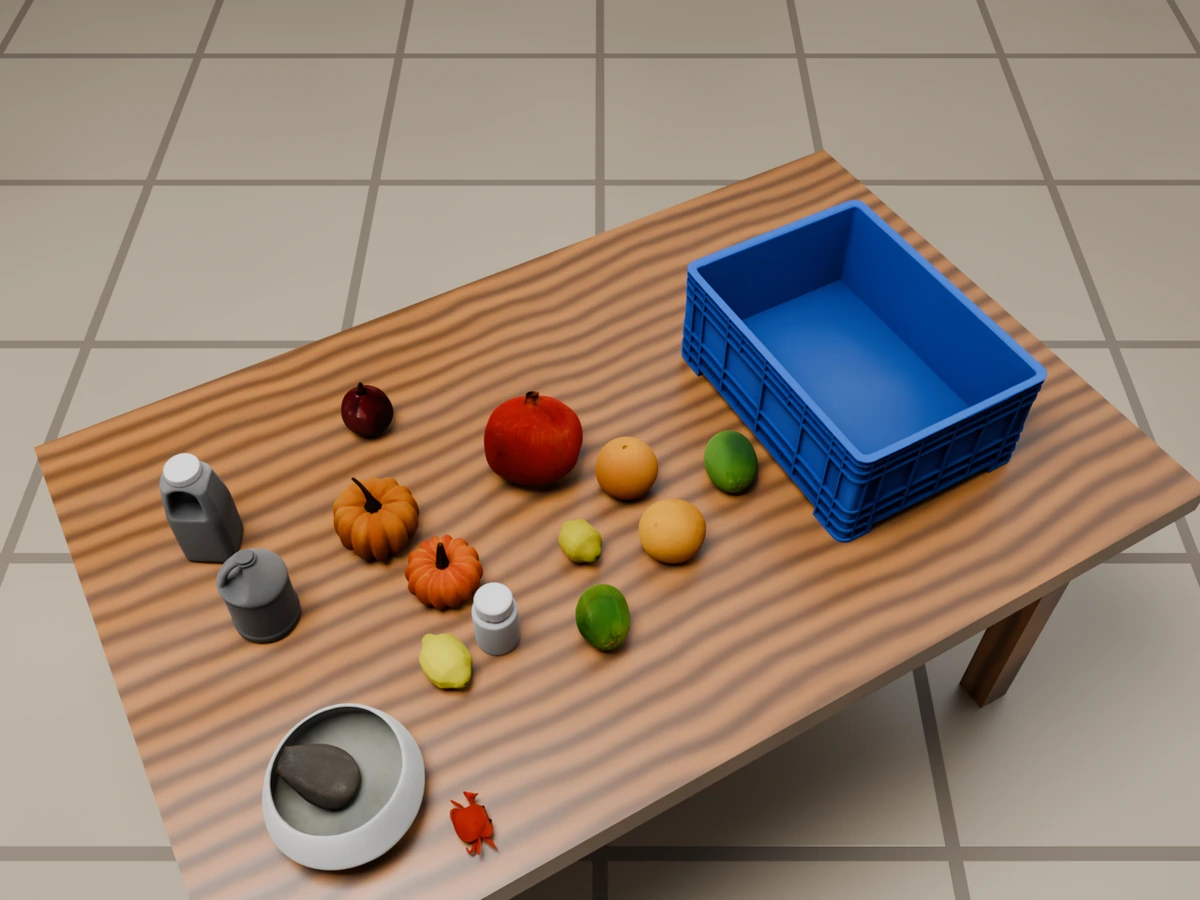 | 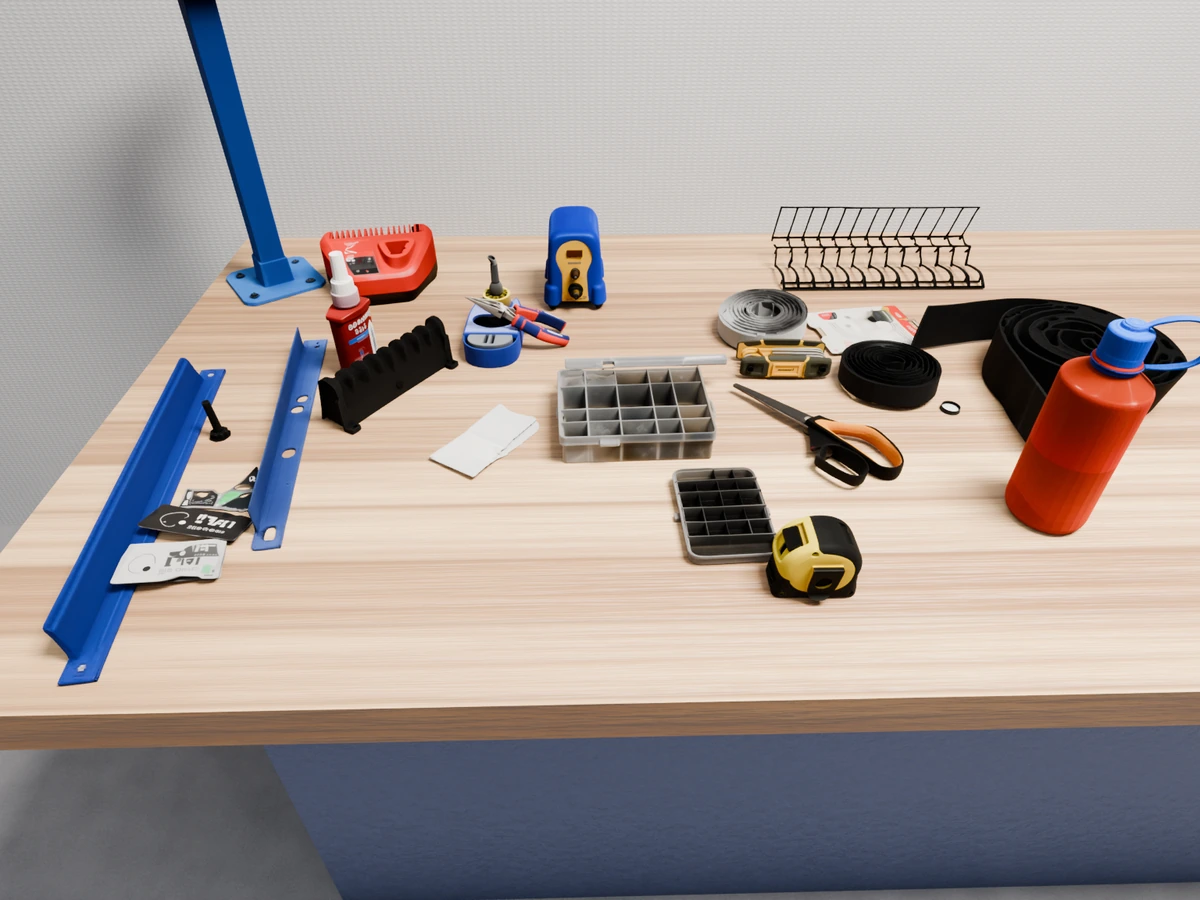 | 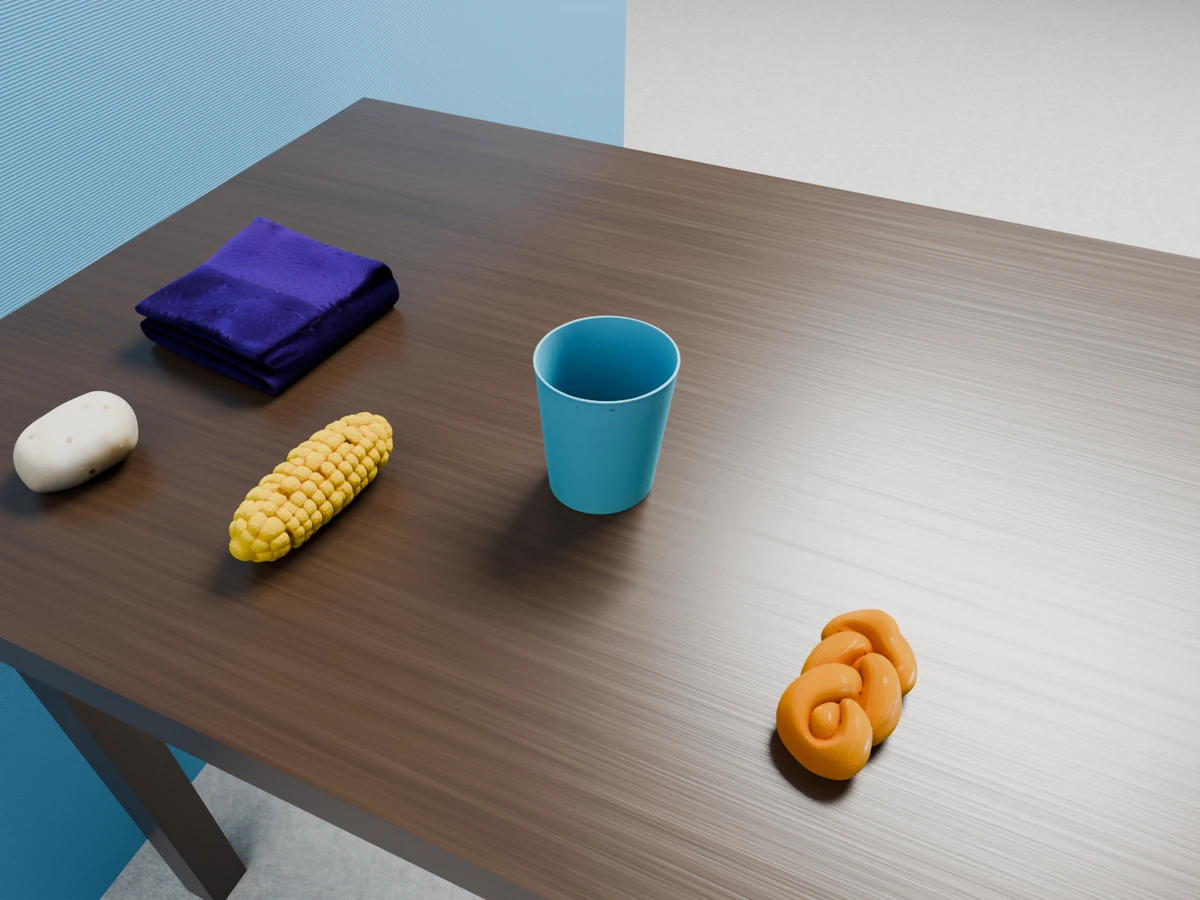 | 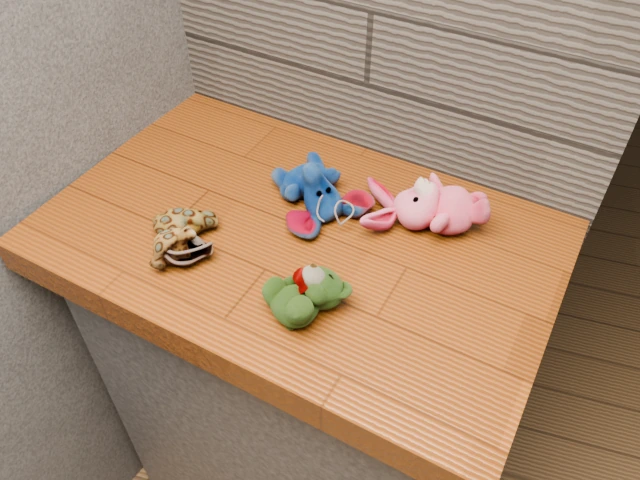 |
Quantitative results on separate matched cohorts
TabletopGen completed 59 of 80 attempted scenes; PAT3D completed 67 of 80, with 13 failures and no jobs remaining. Each baseline is compared with SceneRig on its own completed scenes, so SceneRig has two separate rows. Failed runs are excluded, not zero-filled; no completed scenes were excluded based on appearance.
All applicable completed scenes contribute to these averages; the five examples above are qualitative illustrations. Object and layout scores use the synthetic subsets: 38 scenes for TabletopGen and 35 for PAT3D.
Source-view reconstruction
| Cohort · scenes | Method | PSNR ↑ | SSIM ↑ | LPIPS ↓ |
|---|---|---|---|---|
| TabletopGen cohort · 59 | TabletopGen | 7.927 | 0.516 | 0.752 |
| SceneRig | 13.388 | 0.536 | 0.517 | |
| PAT3D cohort · 67 | PAT3D | 9.795 | 0.538 | 0.743 |
| SceneRig | 13.272 | 0.534 | 0.517 |
Object recovery
PSNR*/SSIM* score ground-truth object pixels, excluding the table and background. LPIPS* averages object crops with non-object pixels set to white. ARI/FG-IoU use the rendered instance masks.
| Cohort · synthetic scenes | Method | ARI ↑ | FG-IoU ↑ | PSNR* ↑ | SSIM* ↑ | LPIPS* ↓ |
|---|---|---|---|---|---|---|
| TabletopGen cohort · 38 | TabletopGen | 0.506 | 0.418 | 9.499 | 0.358 | 0.301 |
| SceneRig | 0.877 | 0.818 | 13.681 | 0.441 | 0.166 | |
| PAT3D cohort · 35 | PAT3D | 0.124 | 0.125 | 9.507 | 0.378 | 0.315 |
| SceneRig | 0.875 | 0.815 | 13.548 | 0.428 | 0.170 |
3D layout
The shared evaluator uses camera-oriented support-plane coordinates and global scale alignment. The OSPA cutoff is 10 cm, and reported OSPA distances are also in centimeters.
| Cohort · synthetic scenes | Method | OSPA@10 cm ↓ | F1@10 cm ↑ |
|---|---|---|---|
| TabletopGen cohort · 38 | TabletopGen | 7.28 | 0.567 |
| SceneRig | 3.19 | 0.926 | |
| PAT3D cohort · 35 | PAT3D | 9.27 | 0.212 |
| SceneRig | 3.01 | 0.948 |
Pairwise VLM evaluation
GPT-5.6 Terra and Qwen 3.8 Max judge anonymous source/+30° panels with the GRASE v4 rubric. Both presentation orders are evaluated; order-inconsistent judgments are discarded and ties receive half credit. Each cohort has a separate mean-centered, two-method Bradley–Terry fit: scores across the two fits should not be used to rank the baselines against each other.
| Cohort · scenes | Method | Completeness ↑ | Layout ↑ | Appearance ↑ |
|---|---|---|---|---|
| TabletopGen cohort · 59 | TabletopGen | -1.273 | -1.744 | -2.172 |
| SceneRig | 1.273 | 1.744 | 2.172 | |
| PAT3D cohort · 67 | PAT3D | -1.572 | -2.794 | -2.794 |
| SceneRig | 1.572 | 2.794 | 2.794 |
Reproduction and evaluation details
PAT3D starts from the supplied benchmark image and uses Hunyuan3D 2.1, GPT-Image-2, and Claude Opus 5. Its original layout, mesh processing, and physics pipeline are retained with the approved segmentation-mask loading fix. Reproduction encountered API rejections, asset/physics failures, and camera-export failures; the completion counts describe this reproduction, not the authors’ reported success rate.
PAT3D’s source camera uses DepthPro intrinsics and the estimated global gravity/support alignment, then follows only the reference support’s vertical displacement during physics. It does not follow individual object pose edits, and the support is not frozen. This is approximate source-camera recovery, with no ground-truth camera fitting or image-score optimization.
PAT3D source scores and panels use the saved Cycles 32-sample render. TabletopGen source scores use its saved pyrender output, whereas its qualitative panels use archived Cycles 96-sample VLM renders. SceneRig uses its existing Cycles evaluation images. Renderer versions, samples, lighting and backgrounds are not normalized across methods. TabletopGen uses supplied synthetic calibration and estimated real-image intrinsics; PAT3D estimates both from its reconstruction.
Nearby views apply the same +30° orbit rule while preserving each method’s orbital radius and elevation; they do not imply identical extrinsics. Images are resized and WebP-encoded for display, with no brightness adjustment. Metrics use the original images.
TabletopGen’s 21 incomplete runs comprise 17 top-view quality-check failures, three Seedream input rejections, and one missing support surface. Additional TabletopGen calibrated/novel-view metrics remain available; those extra pixel metrics are outside the PAT3D comparison reported here.