Question: How does SceneRig compare with TabletopGen?
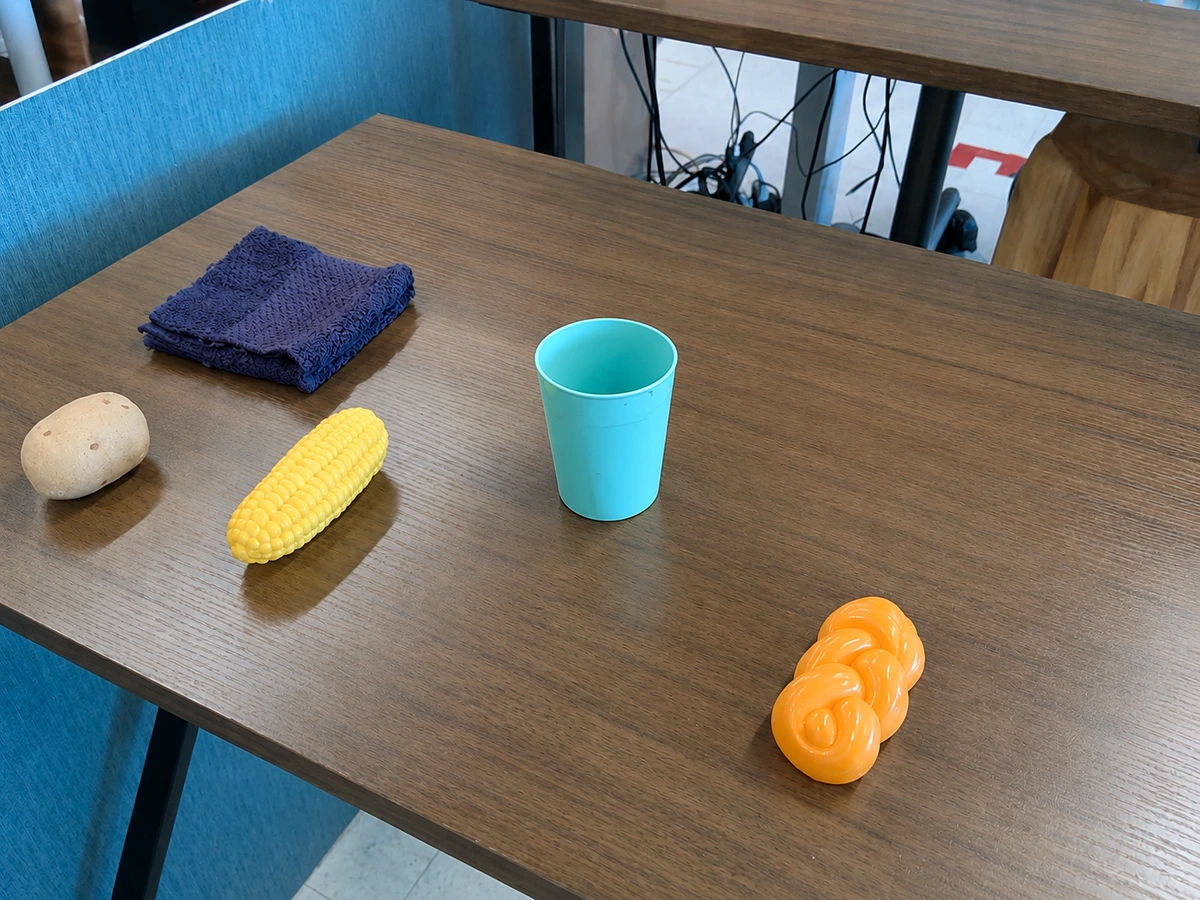
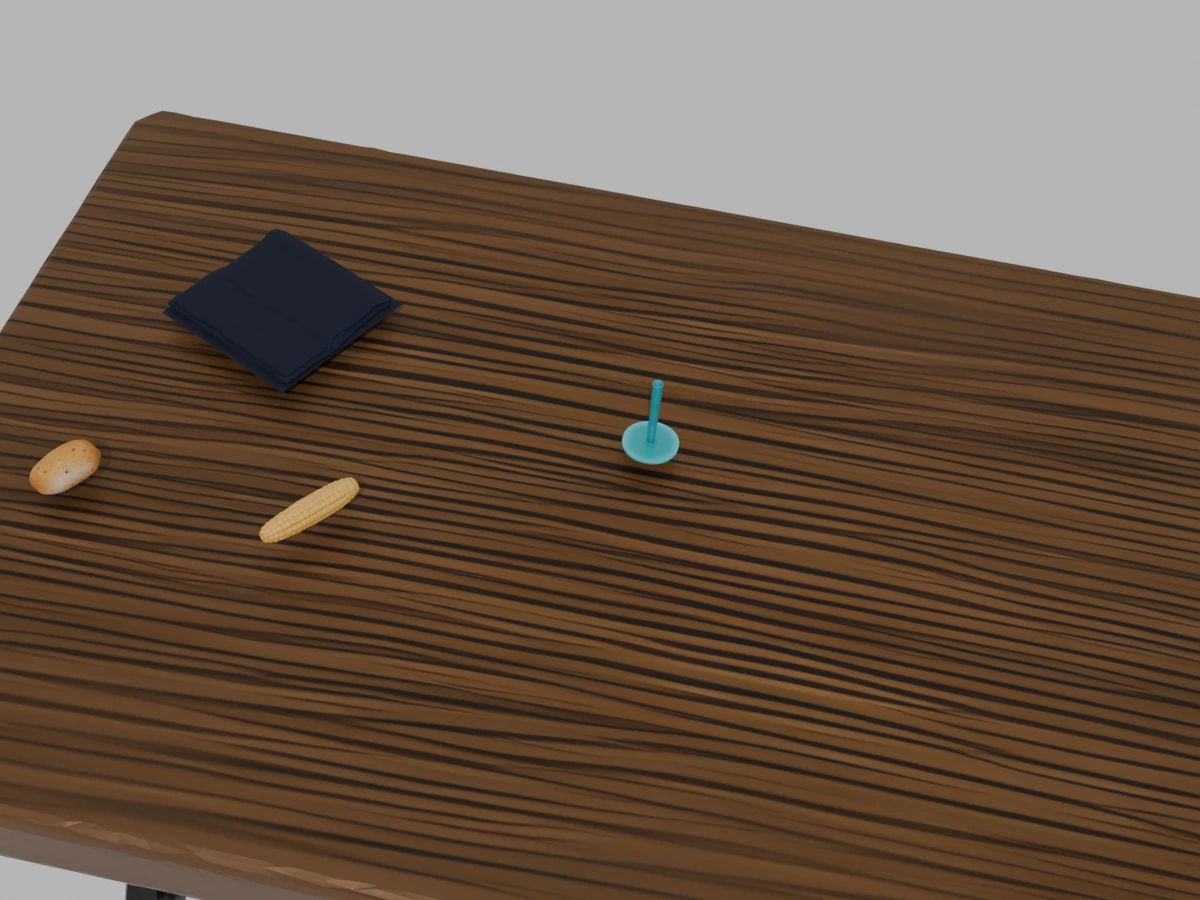
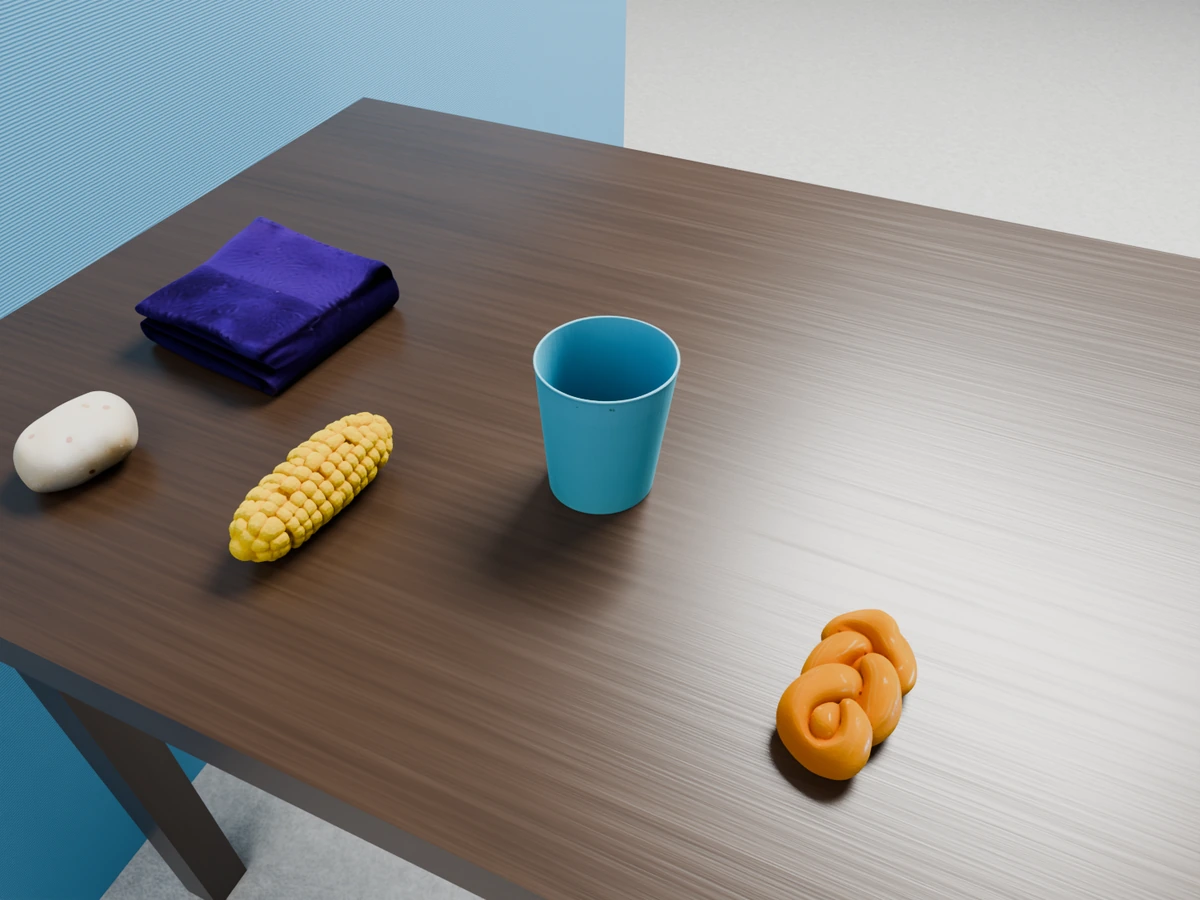
Four selected examples show the input alongside reconstructions from TabletopGen and SceneRig. Switch both methods together between the source view and a novel view at +30° azimuth; select an image to inspect it at full size.
Breakfast table
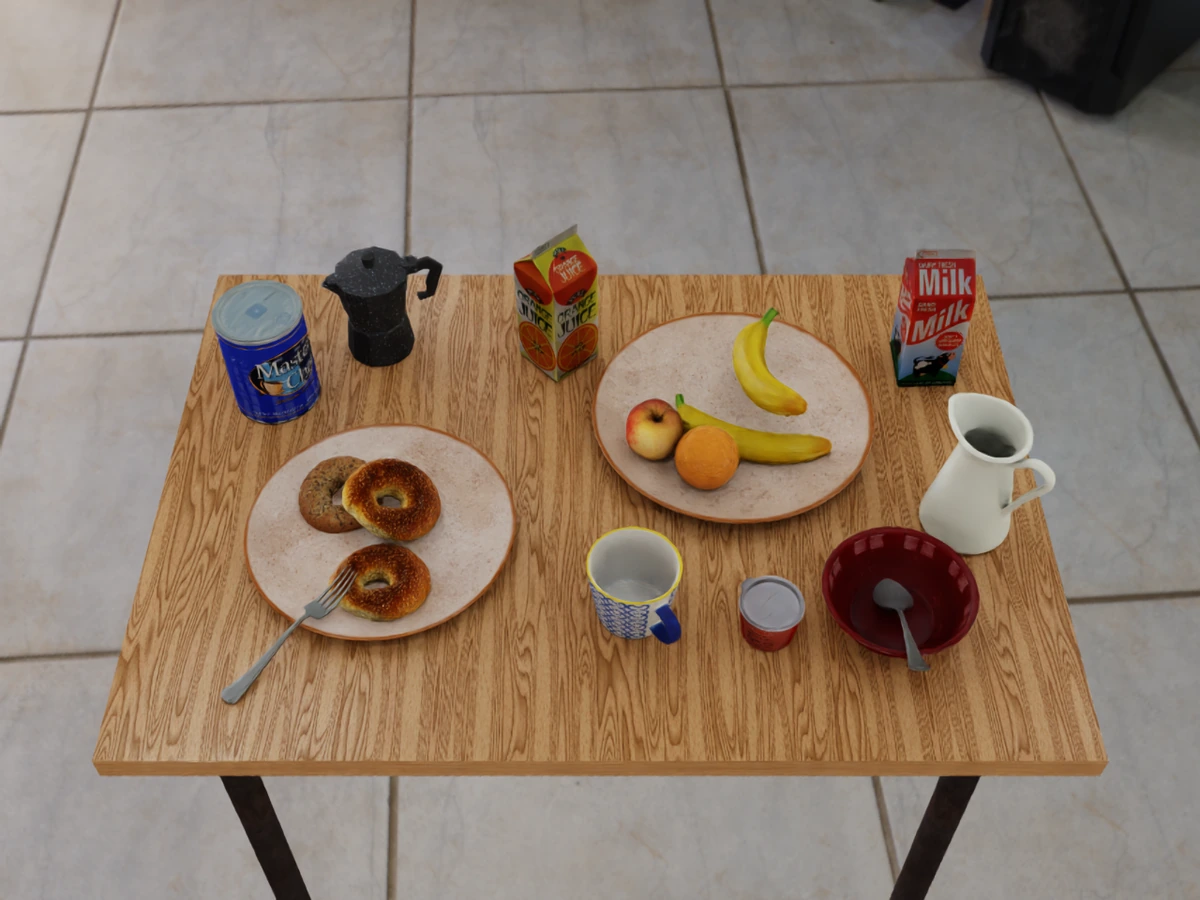
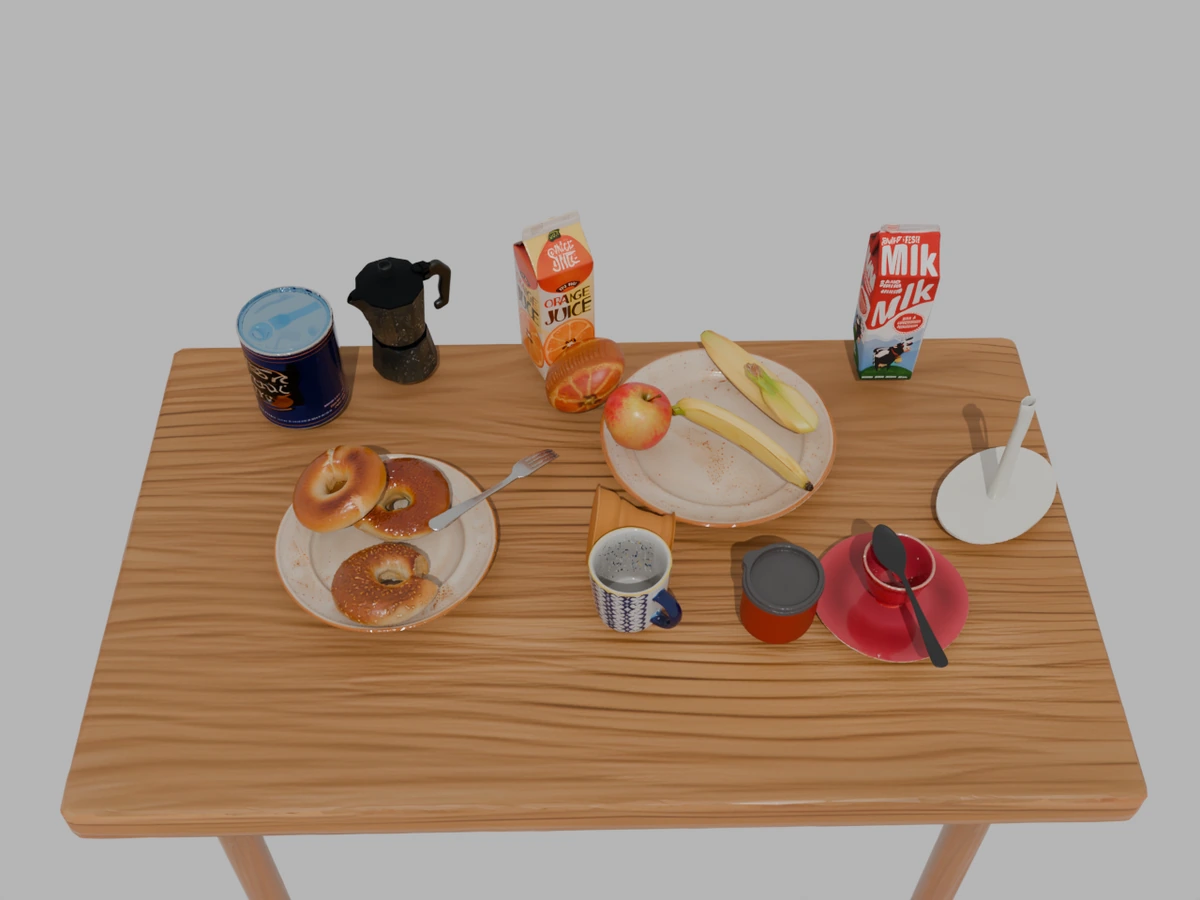
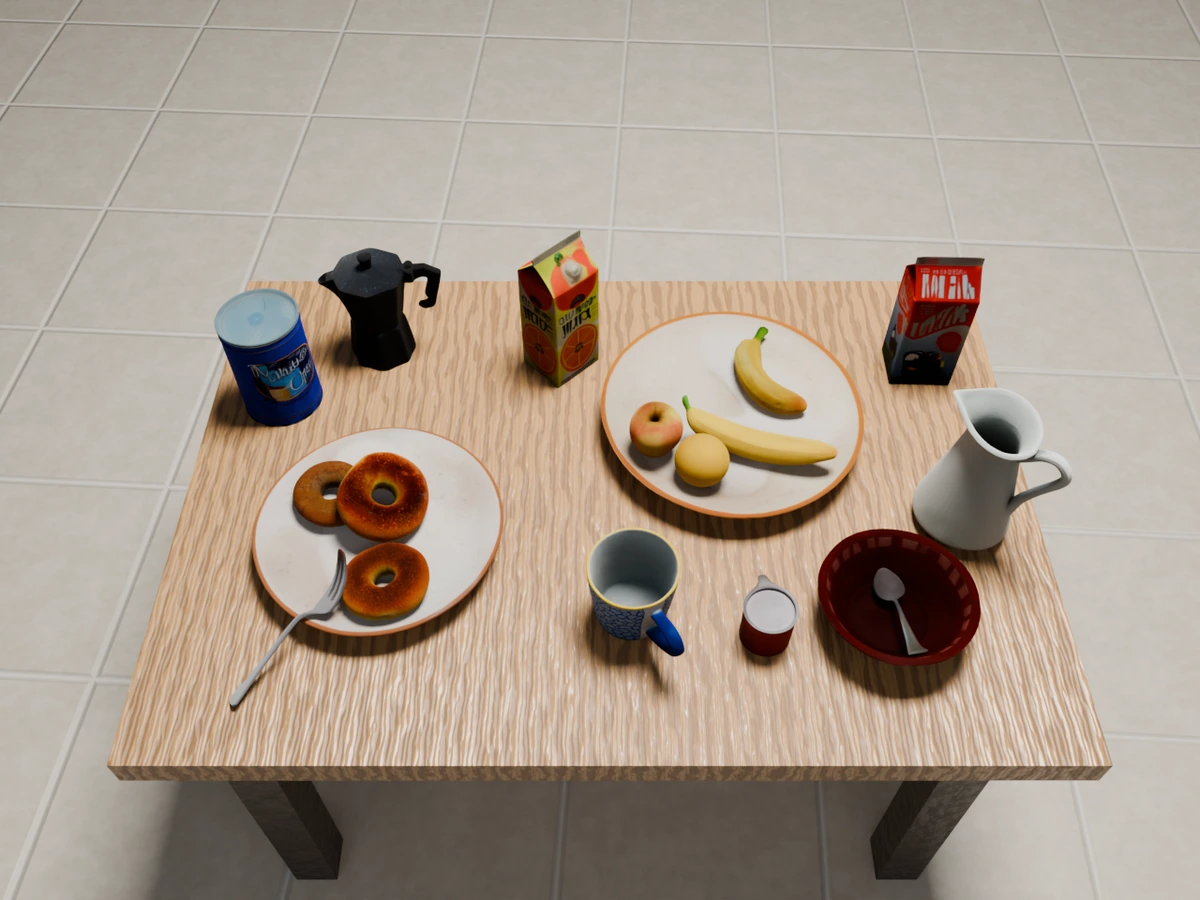
Clutter fruit
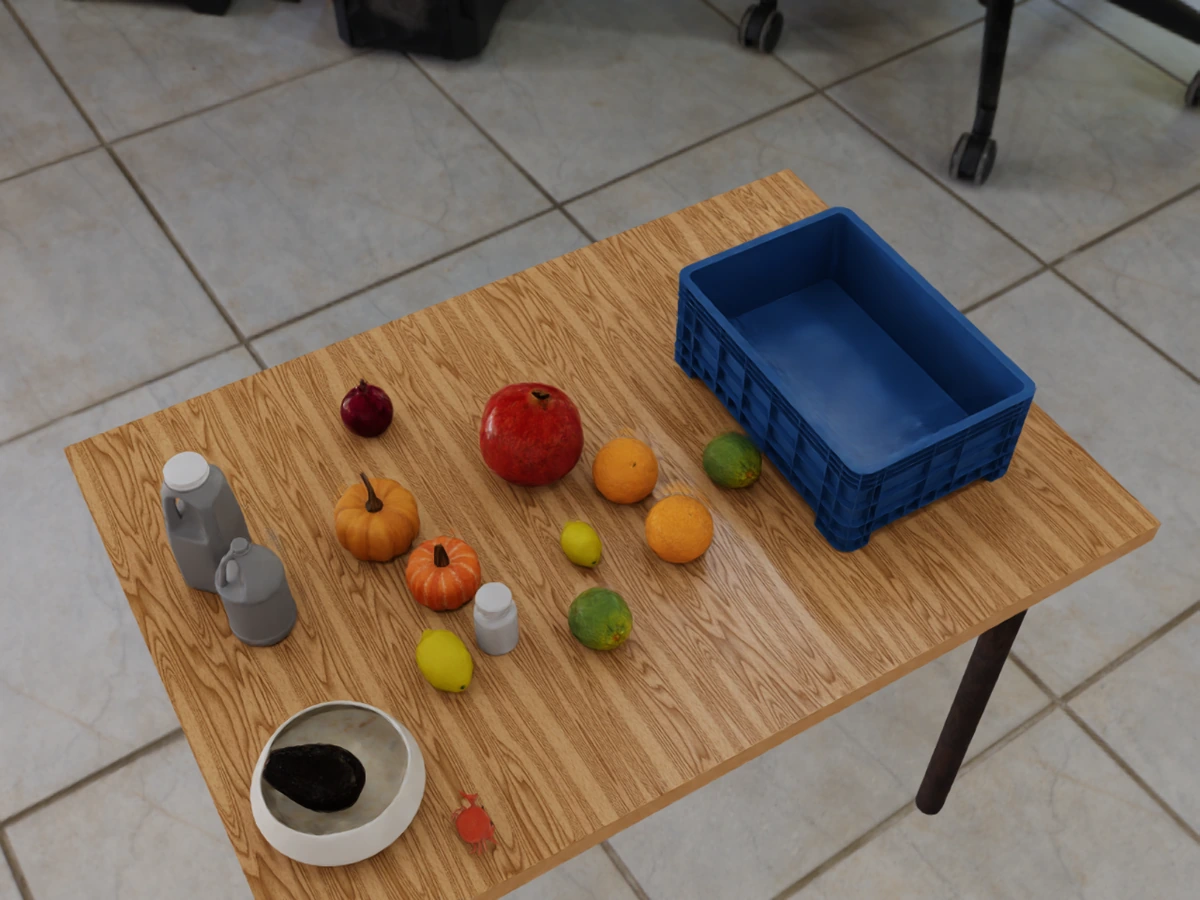
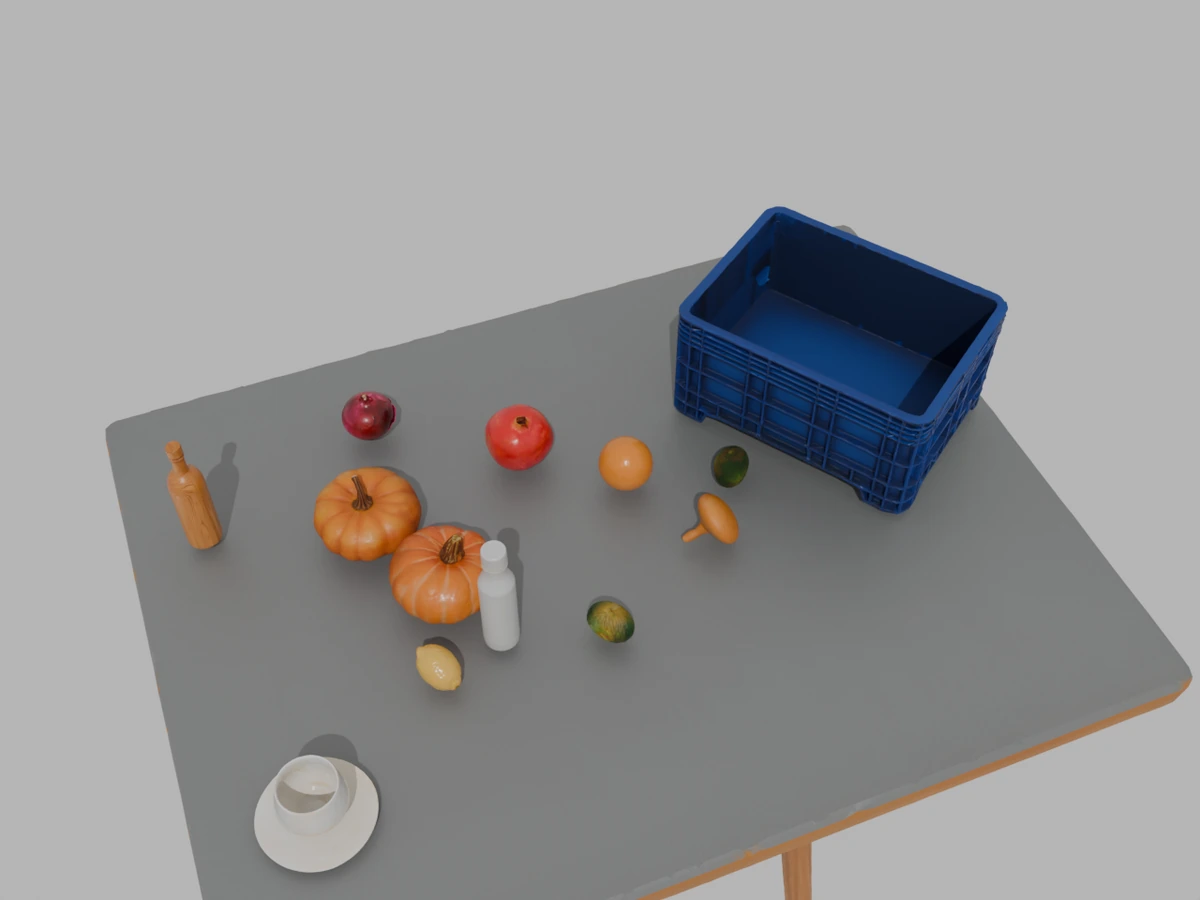
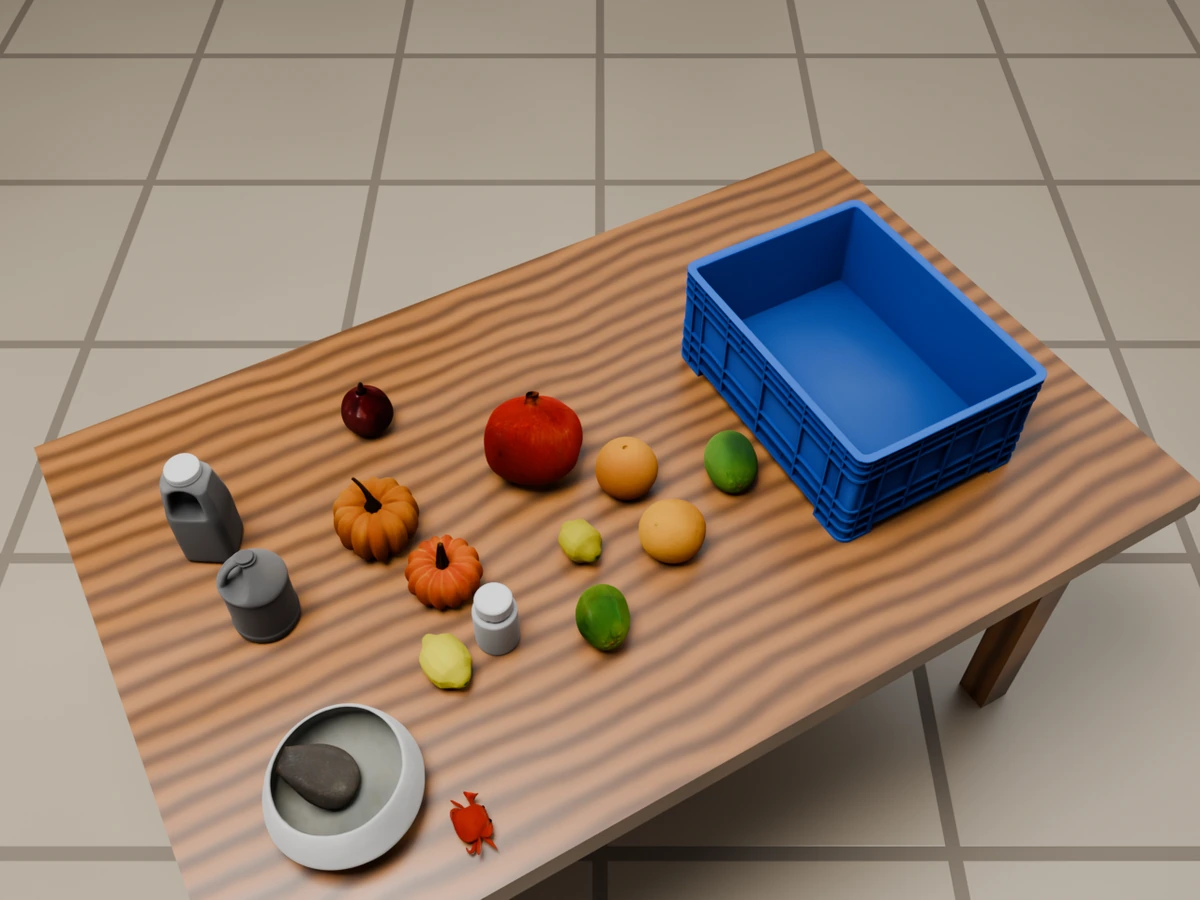
IMG_8334
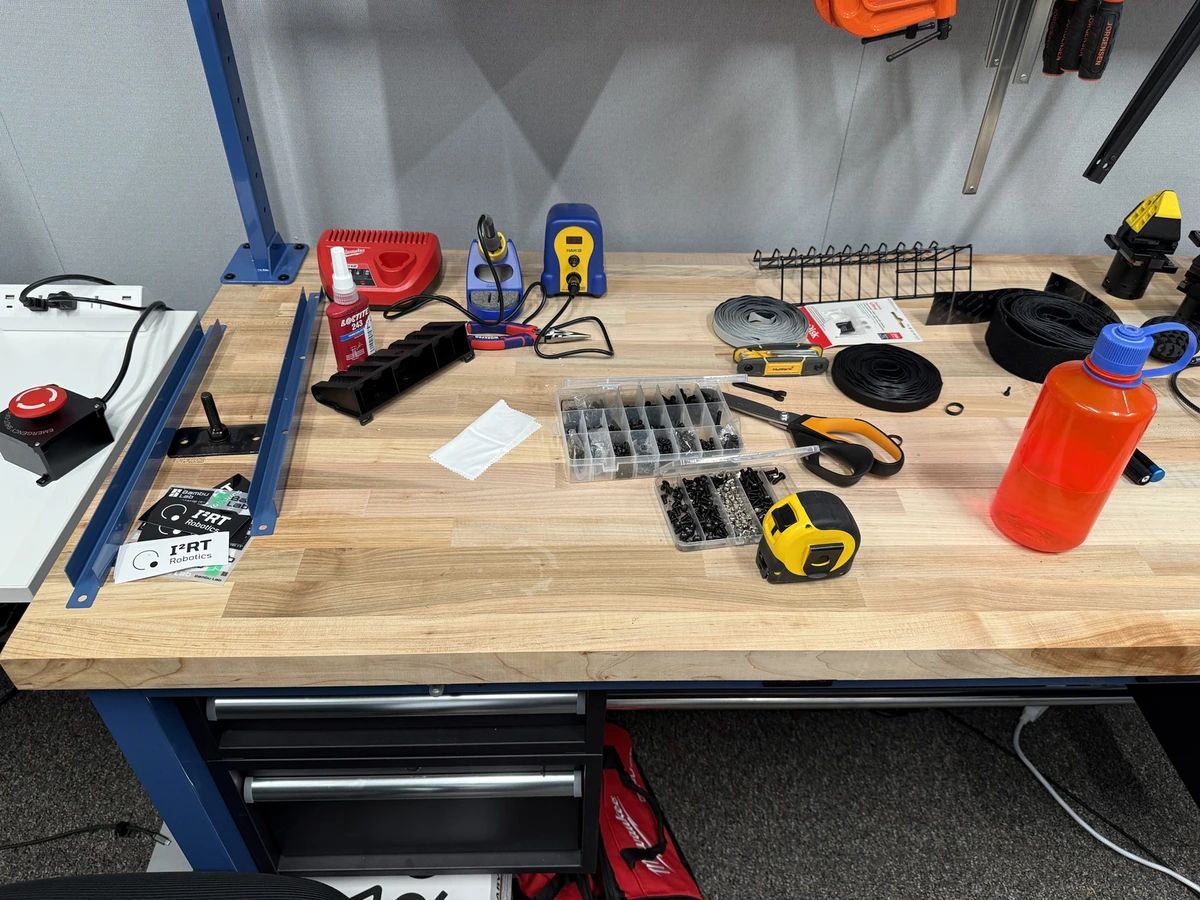
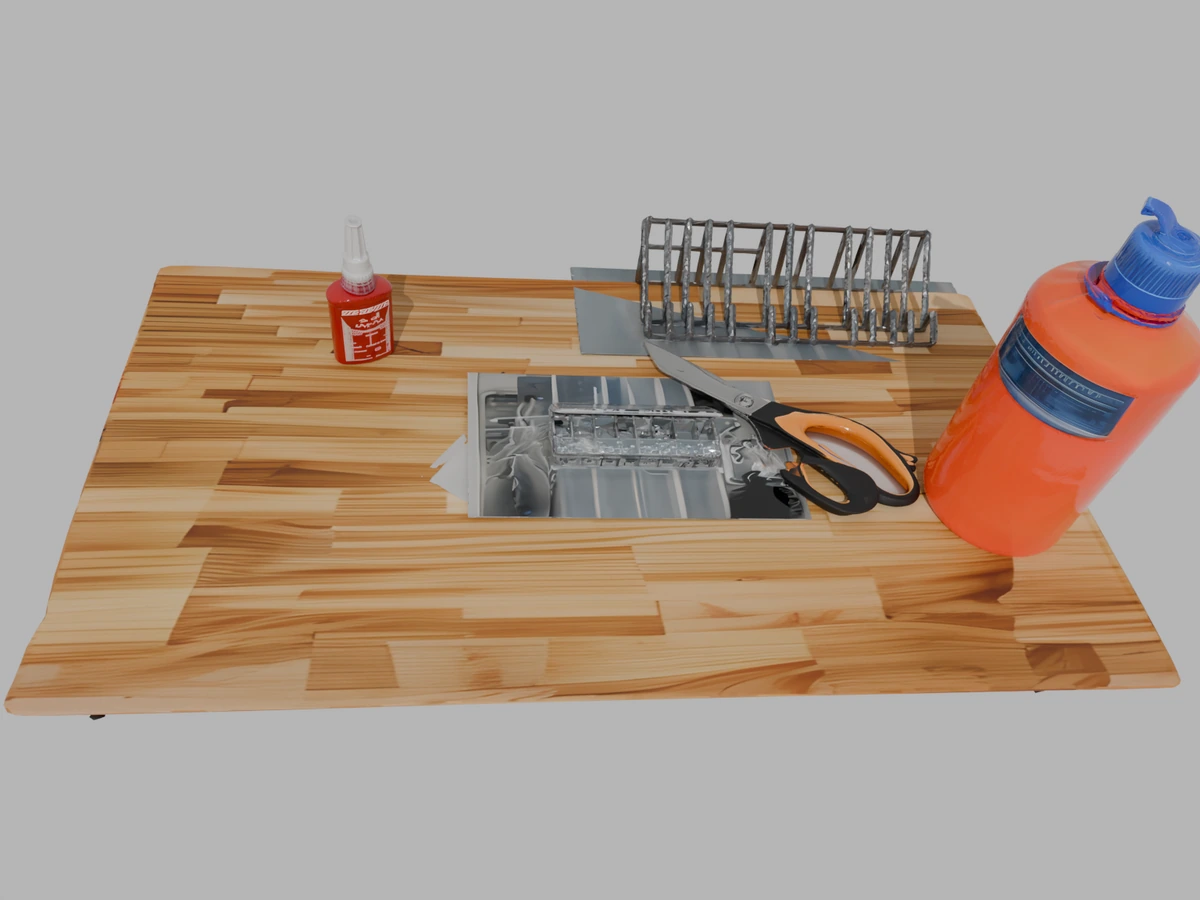
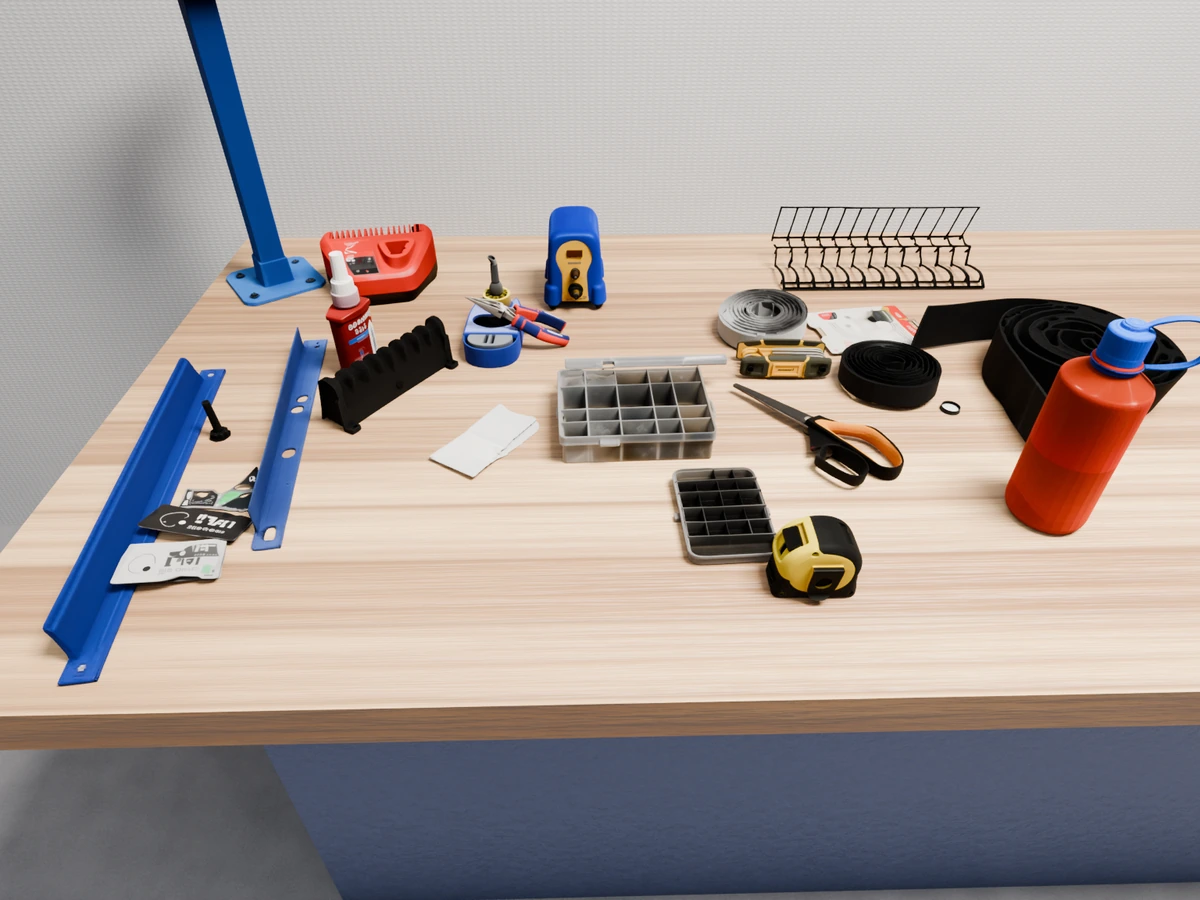
bridge_7
Quantitative results on the matched completed cohort
TabletopGen completed 59 of 80 attempted scenes. Both methods below are evaluated on those same 59 scenes, including 38 synthetic scenes with novel-view and object ground truth. The four examples above are illustrations; all completed scenes contribute to the applicable averages. Failed runs are excluded, not assigned zero scores.
Image reconstruction
Higher PSNR/SSIM and lower LPIPS/nCLIP are better. Views are averaged within each scene, then across scenes; novel-view evaluation uses 35 held-out views per synthetic scene.
| View / cohort | Method | PSNR ↑ | SSIM ↑ | LPIPS ↓ | nCLIP ↓ |
|---|---|---|---|---|---|
| Source · 59 scenes | TabletopGen | 7.927 | 0.516 | 0.752 | 0.228 |
| Source · 59 scenes | SceneRig | 13.388 | 0.536 | 0.517 | 0.127 |
| Calibrated source · 38 scenes | TabletopGen | 12.578 | 0.604 | 0.686 | 0.180 |
| Calibrated source · 38 scenes | SceneRig | 13.054 | 0.519 | 0.591 | 0.121 |
| Novel · 38 scenes × 35 views | TabletopGen | 12.341 | 0.627 | 0.697 | 0.189 |
| Novel · 38 scenes × 35 views | SceneRig | 12.600 | 0.538 | 0.611 | 0.126 |
Object recovery · 38 synthetic scenes
PSNR*/SSIM*: object pixels, excluding the table and background. LPIPS*/nCLIP*: per-object crops with non-object pixels white.
| Method | ARI ↑ | FG-IoU ↑ | Count MAE ↓ | PSNR* ↑ | SSIM* ↑ | LPIPS* ↓ | nCLIP* ↓ |
|---|---|---|---|---|---|---|---|
| TabletopGen | 0.506 | 0.418 | 2.868 | 9.499 | 0.358 | 0.301 | 0.132 |
| SceneRig | 0.877 | 0.818 | 0.237 | 13.681 | 0.441 | 0.166 | 0.061 |
| Method | OSPA@5 cm ↓ | OSPA@10 cm ↓ | F1@10 cm ↑ |
|---|---|---|---|
| TabletopGen | 4.44 | 7.28 | 0.567 |
| SceneRig | 2.46 | 3.19 | 0.926 |
Pairwise VLM evaluation · 59 scenes
Mean-centered Bradley–Terry scores from GPT-5.6 Terra and Qwen 3.8 Max, using the GRASE v4 rubric for completeness, layout and appearance. This is a separate two-method fit. Each judge sees source and +30° views in both orders; order-inconsistent judgments are discarded and ties receive half credit.
| Method | Completeness ↑ | Layout ↑ | Appearance ↑ |
|---|---|---|---|
| TabletopGen | -1.273 | -1.744 | -2.172 |
| SceneRig | 1.273 | 1.744 | 2.172 |
SceneRig’s pooled preference rates are 93.1% for completeness, 97.4% for layout and 99.1% for appearance, over 109, 117 and 116 valid scene–judge pairs respectively; these are model judgments, not human ratings.
Reproduction and evaluation details
Reproduction required API/model substitutions and fixes to the local Hunyuan3D adapter. The run uses 3,000 physics steps. Source-mask registration uses supplied calibration for synthetic scenes and estimated intrinsics for real images.
The source row scores TabletopGen’s saved pyrender output against SceneRig’s existing Cycles rerenders. The calibrated-source and novel rows use Cycles for both methods; renderer versions, sample counts, lights and backgrounds are not normalized. The qualitative panels above use the archived Cycles views used for VLM evaluation, so they differ from the TabletopGen saved source images scored in the first row. Images are resized and WebP-encoded for display, with no brightness adjustment; metrics use the original images.
Both methods use the same +30° azimuth rule around their registered scenes, preserving each method’s orbital radius and elevation. This does not imply identical camera extrinsics. Object-layout scores use global scale alignment; OSPA values and cutoffs are in centimeters. Real scenes lack object and novel-view ground truth.
The 21 incomplete runs comprise 17 top-view quality-check failures, three Seedream input rejections and one missing support surface. These completion counts describe this reproduction with its substitutions, not the original authors’ reported success rate.